Peddling Peril Index
Additional Graphs and Erratum
January 23, 2018
Additional Graphs
Graphs mentioned in the Peddling Peril Index Report can be found below.
Chapter 7: Sensitivity Applied to Adequacy of Enforcement Super Criterion;
Chapter 7: Sensitivity Applied to Ability to Prevent Proliferation Financing Super Criterion;
Annex
Erratum
Table A.3: Tier Two Rank and Super Criteria Scores, pp. 255 - 257. The title of the first column in the table incorrectly states that the numbers in the column represent the Tier One Rank. They represent the Tier Two Rank.
Table A.4. Tier Three Rank and Super Criteria Scores, pp. 258 - 262. The title of the first column in the table incorrectly states that the numbers in the column represent the Tier One Rank. They represent the Tier Three Rank.
The full Peddling Peril Index (PPI) 2017 report can be found as a PDF version here.
For information on how to obtain the PPI ebook or the paperback version, click here.
Images
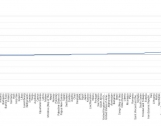
Figure 7.3. The rank change in the overall PPI rank for each county, where negative numbers represent a drop in rank and positive numbers indicate a rise in rank.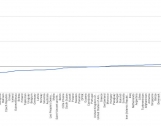
Figure 7.4. Rank change in the Ability to Prevent Proliferation Financing super criterion, when negative indicators are not considered.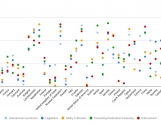
Figure A.1. Countries in Tier One with clustered super criteria ranks can be found to the left, while countries with diverging ranks can be found to the right.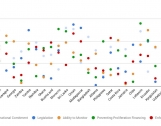
Figure A.2. Countries in Tier Two with clustered super criteria ranks can be found to the left, while countries with diverging ranks can be found to the right.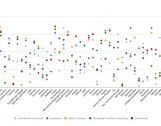
Figure A.3. Countries in Tier Three with clustered super criteria ranks can be found to the left, while countries with diverging ranks can be found to the right.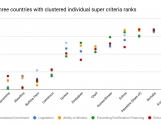
Figure A.4. A selection of Tier Three countries with clustered super criteria ranks, sorted, from left to right, by average rank. All have a standard deviation below 10 in their individual super criteria ranks, which signifies closeness of the super criteria rankings for a specific country. Macedonia is the best ranking country of all countries in this graph, and South Sudan is the poorest ranking country.

 twitter