Reports
The Nuclear Deal in Charts, Assuming a Revived Nuclear Deal
by David Albright, Sarah Burkhard, and Spencer Faragasso
October 20, 2022
October 20, 2022
By David Albright, Sarah Burkhard, and Spencer Faragasso
Six charts show Iran’s historical and projected breakout timelines, enrichment capacities, and enriched uranium stocks from the 2000s until 2031 1 The charts encompass the periods before the Joint Comprehensive Plan of Action (JCPOA), during the JCPOA’s initial years, during Iran’s period of violations following the United States’ exit, and after a possible re-implementation in 2023. This long timespan shows the benefits and drawbacks of a JCPOA. The graphs show that the JCPOA limits Iran’s enriched uranium stocks far longer than its enrichment capacity, even though with the latter, it can quickly reconstitute the former. They also show Iran’s intent to build a large enrichment program legitimized by the JCPOA, able to produce unprecedented stocks of enriched uranium, leading to breakout timelines measured in days rather than months, when major nuclear limitations end. In fact, earlier enrichment capabilities, which caused great international concern, are less than those capabilities permitted after 2025 under the JCPOA.
The six graphs visualize Iran’s sensitive nuclear capabilities historically and in the future, assuming a re-implemented Joint Comprehensive Plan of Action (JCPOA) in 2023. The projections, utilizing conditions in the original JCPOA (2015), associated documents, and Iran’s announced firm plans, cover the period up to and following the end of nuclear restrictions in year 15 of the JCPOA, or 2031. In particular, the future assets and capabilities are drawn from the original JCPOA text, Iran’s secret enrichment and enrichment R&D plan agreed to in 2015, Atomic Energy Organization of Iran (AEOI) public announcements about its enrichment goals, and a nuclear law passed in 2020 by the Iranian parliament. One unfortunate fact is that the original JCPOA limited Iran’s enriched uranium stocks far longer than its enrichment capacity, even though Iran has recently shown that with the latter, it can quickly reconstitute the former. There are no indications that a revived JCPOA would alter this intrinsic inequality in limits.
Perhaps the most telling values are those tracking the time it would take Iran to accumulate enough weapon-grade uranium (WGU) for its first and subsequent nuclear weapons, known as breakout timelines. These breakout times under a revived JCPOA depend on Iran’s enriched uranium stockpile and enrichment capacity of deployed centrifuges, but also on Iran’s ability to quickly reconstitute and ramp up the number of redeployed centrifuges beyond what is permitted by a revived JCPOA. The latter largely depends on the number of powerful, advanced centrifuges Iran has placed in storage under the revived JCPOA. As of now, it appears that Iran will be allowed to store the almost 2800 advanced centrifuges it had deployed as of September 2022 (primarily the IR-2m, IR-4, and IR-6) and additional ones made or deployed until a potential deal is reached. In 2015, Iran was allowed to store about 1000 IR-2m centrifuges. (Iran also stored thousands of IR-1 centrifuges in 2015, and it could also redeploy these in a breakout, but their contribution to breakout is significantly less than that of the advanced centrifuges.)
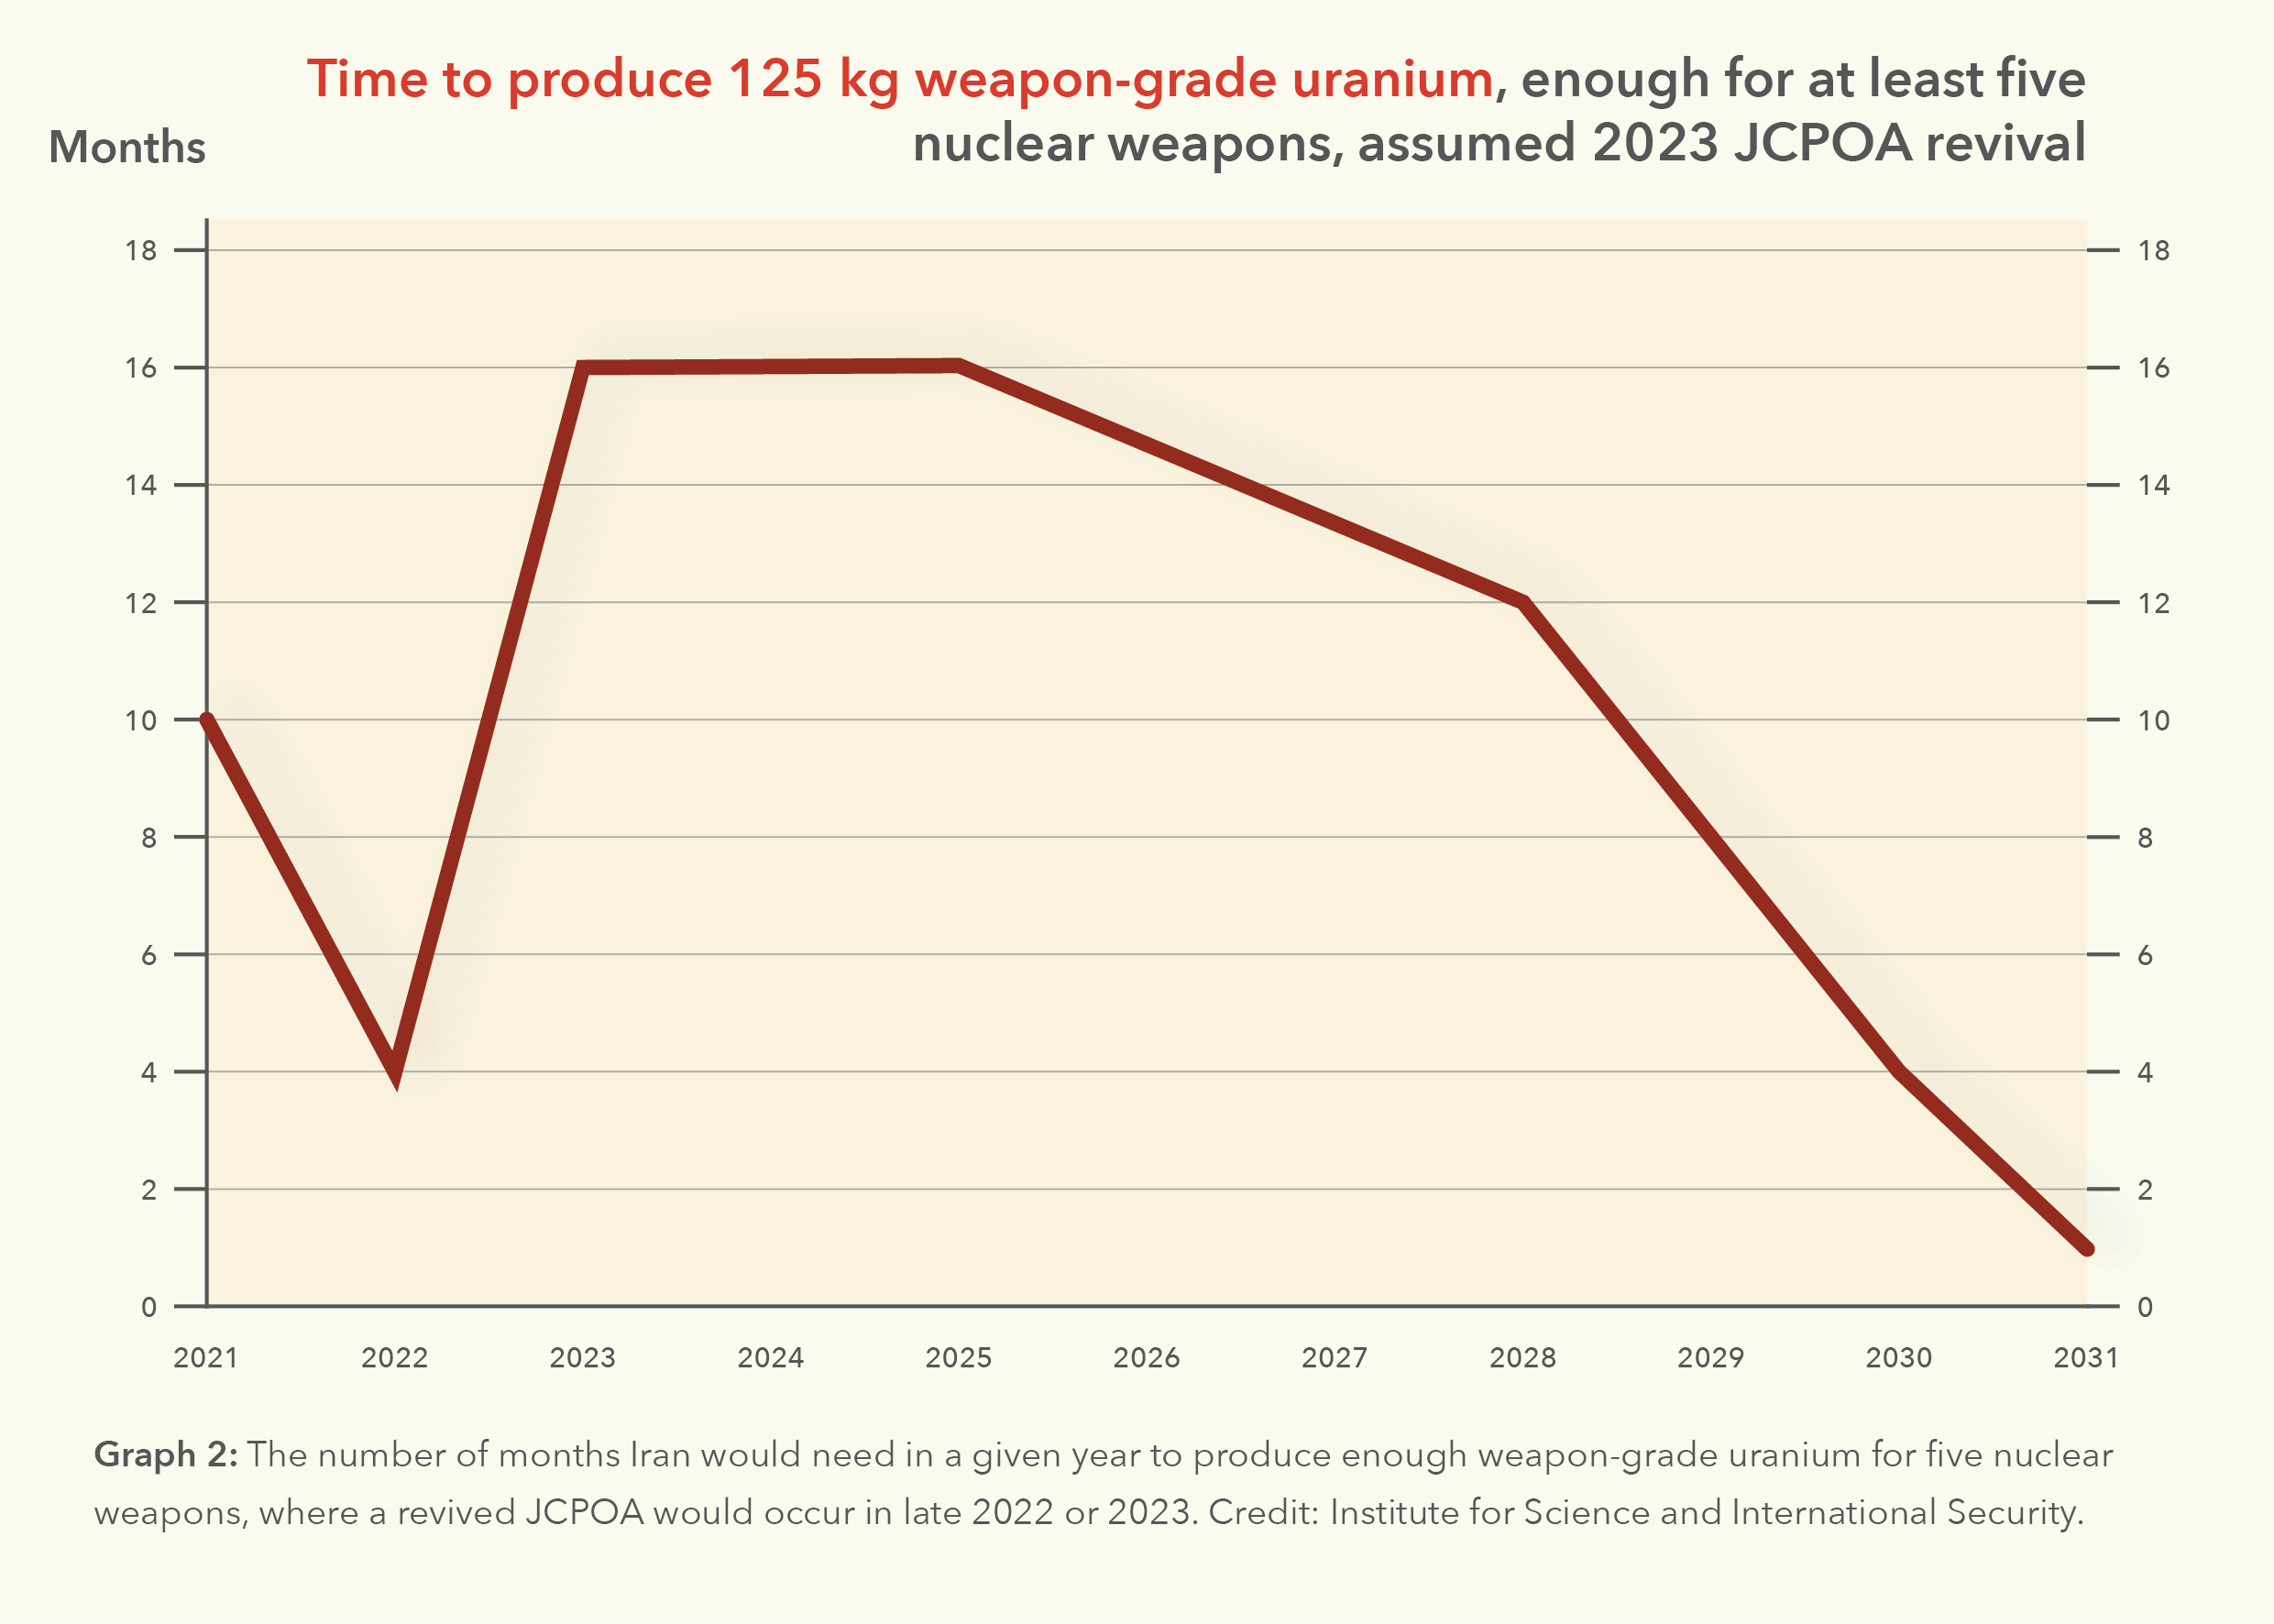
Graph 1 tracks the time it would take Iran to acquire its first quantity of weapon-grade uranium for a nuclear weapon, where 25 kg are considered more than sufficient, covering the period from 2009, when Iran first became capable of breaking out, until 2031. Graphs 2 and 3 visualize how many months it would take Iran to accumulate five weapons’ worth of WGU, and how many weapons’ worth of WGU it could produce within six months. As the breakout times to the first or the first five weapons’ worth of weapon-grade uranium drop to days or one month, respectively, after 2030, the quantity of weapon-grade uranium Iran could produce within six months skyrockets to enough for up to 23 weapons.
Graph 4 tracks Iran’s historical and firmly planned enrichment capacity installed at its three known enrichment plants at Natanz and Fordow. It shows that a revived JCPOA in 2023 would have little lasting impact on Iran’s enrichment capabilities, limiting Iran’s deployed enrichment capacity for two to three years before enrichment capacity would increase after 2025 and rapidly accelerate after 2028, reaching unprecedented levels once key restrictions are reduced and eventually removed. Iran’s enrichment and enrichment R&D plan foresees a steady buildup of IR-2m and IR-4 centrifuges between year 10 and year 13 (2025 to 2028), and Iran plans for unrestricted growth in these centrifuges afterwards, a growth not prohibited by the JCPOA (2015). Iran is emphatic about its goal to quickly reach an enrichment level of 190,000 kg UF6 SWU per year (125,000 kg U SWU per year, aka 125,000 SWU per year). Towards this goal, Iran is currently building centrifuge manufacturing and assembly facilities, which it can also do under the JCPOA. Whether Iran can actually meet its goal in 2030 is a question, but it fully intends to do so and the JCPOA as written in 2015 does not prohibit it. Only Iran’s own incompetence, unexpected setbacks, or new nuclear limits can prevent this dangerous growth.
Graph 5 tracks Iran’s historical and predicted enriched uranium stockpile from 2007 until 2031, showing ebbs and flows of Iran’s stocks. As noted above, the JCPOA (2015) maintains a stricter limit on stocks of enriched uranium than it does on enrichment capacity. However, after 2030, those limits on stocks end, including limits on the level of enrichment reached. At that point, Iran can produce amounts of enriched uranium that dwarf its current stocks and those prior to JCPOA implementation in 2016.
The last graph, Graph 6, places Iran’s enrichment capacity over time in context of United Nations Security Council (UNSC) resolutions on enrichment or multilateral agreements that were in effect at a given time. Notably, in stark contrast to the enrichment suspension and ban imposed in the early 2000s, there is no UNSC opposition to Iran’s increase in enrichment capacity after 2025 as such a buildup is not prohibited under the JCPOA or a revived one.

Comments on graph
The breakout times were calculated in cooperation with centrifuge experts at the University of Virginia prior to 2016 and by an Institute breakout calculatorafterwards.
The results depend on both Iran’s enrichment capacity and stocks of enriched uranium. During times when nuclear limits are in place, the result also depends on the numbers of stored centrifuges that can be redeployed in a breakout. With regards to the last point, after 2022 and a revival of th e deal, re-deployment of stored centrifuge cascades is assessed to occur at a rate of one cascade per week, based on Iran’s accomplishments post-2018
The breakout value of eight months from 2016-2019 reflects the redeployment during the initial period of the breakout of about 1000 IR-2m centrifuges dismantled and stored under the original JCPOA. In 2015, the United States took the position that Iran would not redeploy these centrifuges in a breakout, according to senior Department of Energy officials, resulting in their calculation of a twelve-month breakout time. Iran’s relatively rapid redeployment of IR-2m centrifuges post-2018 shows their value to Iran and indicates that they would be redeployed in a breakout.
Only Iran’s centrifuge types deployed in full cascades (IR-1, IR-2m, IR-4 and IR-6) or those planned to be deployed in a full cascade (IR-8) would contribute in a breakout to weapon-grade uranium.
Because Iran’s centrifuges do not operate at maximum efficiency in a cascade and in a multi-step enrichment process to reach weapon-grade, inefficiency factors are applied to the centrifuges’ nominal enrichment outputs.
The values represent the end of the respective year, except for 2022, where September values are used.
Comments on Graph
The values represent the end of the respective year, with the exception of 2022, where September values are used.
The values are calculated using an Institute breakout calculator.

Comments on Graph
The values represent the end of the respective year, with the exception of 2022, where September values are used.
The values are calculated using an Institute breakout calculator.

Comments on Graph
The historical nominal enrichment capacity is calculated based on Institute analyses of quarterly IAEA reports found at www.isis-online.org.
This graph, which captures deployed centrifuges, does not include additional capacity in stored centrifuges, such as those dismantled under the 2015 JCPOA or those stored under a revived deal, which would be highly relevant for a breakout, because these centrifuges can be redeployed relatively rapidly in a breakout (post-2018, Iran achieved a redeployment rate of one cascade a week.)
For future years, enrichment capacity is estimated based on JCPOA restrictions, Iran’s secret enrichment and enrichment R&D plan, and official Iranian announcements. For example, in 2028, under the JCPOA and Iran’s enrichment and enrichment R&D plan, Iran is allowed an actual enrichment capacity in IR-2m and IR-4 centrifuges of 12,500 kg U SWU/yr, determined under agreed procedures of rigorous testing of enriched uranium output from IR-2m and IR-4 cascades. This actual enrichment capacity already factors in inefficiencies. The equivalent nominal value is used here, which is typically larger than the actual one by over 40 percent.
Iran has announced firm plans to quickly achieve a nominal enrichment capacity of 190,000 kg UF6 SWU per year (125,000 kg U SWU per year, aka 125,000 SWU per year) and reach that level in about 2030. It has built or is building the needed facilities to make the requisite number of advanced centrifuges to achieve this capacity.
By the middle of year 8, or 2023, Iran is allowed to deploy two partial cascades, one of IR-6 and one of IR-8 centrifuges, containing 30 centrifuges each.
By year 12, per Iran’s enrichment and long-term enrichment R&D plan, Iran is allowed to also have a full cascade of IR-6 and a full cascade of IR-8 centrifuges, containing 150 and 84 centrifuges respectively.
Iran may also have a clandestine stock of advanced centrifuges, but quantifying this amount is very difficult without considerably more information. As a result, this quantity is not included here.
The graph does include 1044 IR-1 installed but not enriching centrifuges at Fordow when the JCPOA is in effect, per JCPOA Article 6.
Iran also has several thousand IR-1 centrifuges in storage that were dismantled in 2015 under the JCPOA. Public estimates put the current number in storage at 3000 - 9000 IR-1 centrifuges. The upper bound does include IR-1 centrifuges that have broken or been destroyed as that number is publicly unavailable, but it likely amounts to thousands of IR-1 centrifuges.
This graph ignores single and small cascade deployment of centrifuge types at the Natanz pilot enrichment plant other than IR-2m and IR-4 production-scale cascades between 2006-2011.
The values represent the end of the respective year, with the exception of 2022, where September values are used.

Comments on Graph
The historical enriched uranium stocks are based on Institute analyses of quarterly IAEA reports found at www.isis-online.org.
Stockpiles of enriched uranium are in the form of uranium hexafluoride (UF6) and uranium oxides, (reported in actual and equivalent uranium hexafluoride mass).
The stocks include all enriched uranium, in particular both low and highly enriched uranium.
The rapid growth in the enriched uranium stock after 2030 reflects Iran’s large, planned increase in enrichment capacity. The values are calculated by assuming that the actual capacity in those years will be 70 percent of the nominal enrichment capacity of 125,000 SWU per year.
The values represent the end of the respective year, with the exception of 2022, where September values are used.

Comments on Graph
The time spans in the graph cover:
An Iranian suspension of its uranium enrichment and reprocessing programs from 2003 to 2006;
A period from 2006 to 2015 when Iran operated its enrichment program in violation of UN Security Council resolutions banning such activities;
The period after UN Security Council Resolution 2231 in 2015, which reversed bans on Iran’s uranium enrichment program;
The period after 2018, when the United States stopped participating in the JCPOA and reimposed sanctions on Iran, and Iran started violating its JCPOA enrichment commitments; and
The period of a possible revived deal from 2023 onwards.
1. We would like to thank Jonathan Schachter for his input on the graphs. ↩
 email us
 twitter