Reports
New Thermal Power Estimates of the Khushab Nuclear Reactors
by David Albright, Sarah Burkhard, Claire Chopin, and Frank Pabian
May 23, 2018
Little official information exists about the four Khushab nuclear reactors, which make plutonium for Pakistani nuclear weapons. A key parameter is the power of the reactor, which is directly related to the amount of plutonium the reactors can make. As a result, there have been many estimates of the reactors’ power. The construction of a Thermal Power Plant (TPP) at the nuclear site in Khushab opens a new pathway to estimate the publicly unknown power of the adjacent four nuclear reactors. In contrast to the plutonium production reactors, publicly available information exists on the TPP, which seems to be in its final construction phase.1 The Institute used commercially available satellite imagery to measure the dimensions of the TPP’s cooling tower set and compared its volume and horizontal cross-sectional area to those of the four Khushab reactors in order to derive estimates of the reactors’ power. The findings confirm that the reactors do not all have equal capacities. Especially the latest reactor built in 2011, Khushab 4, appears to have significantly greater power than the other three reactors, up to 90 megawatts-thermal (MWth). Khushab 1 is estimated to have a power of 30-40 MWth; and Khushab 2 and 3 reactors are estimated to have a power of 40-50 MWth. The uncertainty in these estimate makes these findings preliminary, but overall represent a lowering of our previous power estimates of these reactors. These values were compared to other estimates of the reactors’ power.
Background
A recurring challenge has been to estimate the thermal power of the Khushab reactors; Pakistan provides no information about the power of these reactors. When we first revealed the existence of the Khushab 2 reactor in 2006, we based our estimates of the power of the reactor on evaluating the size of the reactor vessel and comparing it to the experience at the Savannah River reactors in South Carolina. This analysis led to power estimates in the hundreds of megawatts-thermal. At the time of the analysis, the cooling towers of the reactor were not yet visible, which could provide another method to assess the power of the reactor. Subsequent analysis by Thomas Cochran,2based on the surface area of the new cooling towers and an upper bound estimate of heat discharge per surface area drawn from Lev Davidovich Berman3, showed that such high estimates were not supported by the ability of the then emerging mechanical draft cooling towers to discharge the reactor’s heat.4 A later effort by Tamara Patton tried to more precisely define the cooling towers’ thermal output, based on Cochran’s approach utilizing Berman’s upper bound estimate of the rate of heat discharge per area of cooling tower.5 However, Berman’s estimate does not hold for all types of mechanical draft cooling towers and Patton made several assumptions about the specific nature of the cooling towers, which were partially supported by the visual evidence in satellite images. With these assumptions Berman’s estimate of heat transfer over time per meter square is more justified and its use resulted in an upper bound estimate of the power of Khushab 1, 2, and 3 reactors after deriving the surface area of the cooling towers of each of these reactors from readily measurable values in commercial satellite imagery.
Given the ongoing uncertainty about the question of the power of the Khushab reactors, we were motivated to look again at the power issue when we observed the construction of a Thermal Power Plant at Khushab, which also uses mechanical draft cooling towers. The same level of secrecy does not apply to this facility as to the reactors. The TPP is nearing operation, and its electrical rating and thermal efficiency are public. The cooling towers associated with the thermal plant provide a new set of data to evaluate the four Khushab reactors’ power, all of which also use mechanical draft cooling towers.
According to the Generation License published by the Pakistan Atomic Energy Commission (PAEC) in March 2017, the Khushab TPP is a “50.00 MW Coal Fired Plant, where this value is the electrical generation from two units”6 It has a reported gross efficiency of 31.25 percent. 7 This translates to a total thermal power of 160 MWth. Given that a certain fraction of the generated heat, given by some sources as up to 15 percent of the total, goes up the stack in emissions gases,8 the cooling towers must discharge at least 100 MWth of waste heat from the coal plant in the form of hot water, which needs to be cooled in the cooling towers.
Cooling Towers Volume Comparison
The first method, which likely overestimates the power of most of the reactors, involves measuring the volume of the cooling towers of all five facilities and scaling the power. The horizontal area and the height of the rectangular frame surrounding the towers were measured (see annex on these measurements and their uncertainties). 9 It is noteworthy that all cooling tower sets look different. Even reactors 2 and 3, which are built next to each other and look like cookie cutter versions of one another, have cooling tower sets that differ in number and size of the fan shafts. This can be seen in figure 1. The cooling tower set of the TPP can be seen in figure 2.
Each of the nuclear reactors has a main bank of cooling towers and one or more smaller subsets of cooling towers. The reason for this differentiation, and thus their purpose, is not clear. In a review of satellite imagery available to us, it was noted that not once from 2009 to 2018 were we able to observe steam rising from the cooling tower subsets. Additionally, the subset for Khushab 1 was not added until 2016 (see figure 3). (This provides additional evidence that the facility is not only still operating, but being augmented, showing a Pakistani commitment to maintaining operations at its first plutonium production reactor). The additional cooling units at each reactor may support slightly increased power levels or supplement less than optimally efficient original equipment cooling from the main deck of cooling towers. However, the subsets could also just be associated with environmental HVAC for the interior of the buildings. Alternatively, these extra cooling towers could be a reserve in case of a reactor accident. Because of these uncertainties, these subsets were not included in the estimates of reactor power.
![]()
Figure 1. The cooling towers of Khushab 1 - 4 (clockwise) differ in size and number of fan shafts.
![]()
Figure 2. The cooling towers of the TPP, under construction in 2017 and finished in 2018.
![]()
Figure 3. A subset of two cooling towers was added at Khushab 1 in 2016.
After ignoring the volume of the subsets of cooling towers, in percentages, the volume of the main cooling towers of Khushab 1 is approximately 32 percent of the volume of the cooling towers of the TPP; for Khushab 2 this volume is about 65 percent of the TPP cooling towers; for Khushab 3 it is about 76 percent, and for Khushab 4, the volume of the cooling towers represents approximately 170 percent of the volume of the TPP cooling towers (see table 1).
The Khushab 4 cooling tower volume is notably greater than the other ones, which indicates an increased capacity. It would not come as a surprise if Khushab 4 has indeed a significantly greater power than Khushab 2 and 3. Not only was this reactor built at a distance to the other reactors, but also, as we monitored the construction progress from 2011 to 2015, it became evident that the progress was much slower than expected, especially in comparison to the construction of the previous reactors.10
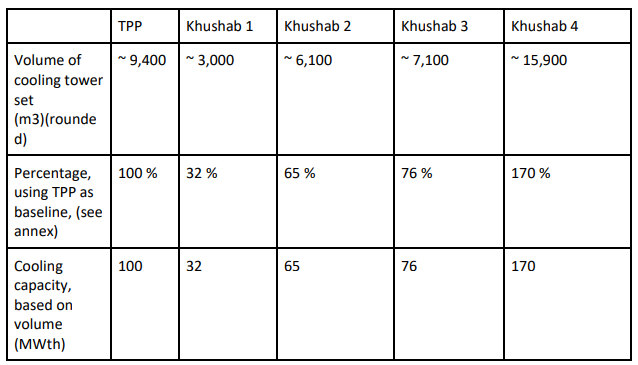
Table 1. Cooling tower volumes and inferred cooling capacities from TPP data.
Measurements of the horizontal area of cooling towers
Another approach is to attempt to derive the thermal discharge potential of the cooling towers from their horizontal cross-sectional area. This type of approach works better than the volume-based approach if the cooling towers are counterflow coolers with film fill. Although film fill towers are generally counterflow coolers, the towers could also be counterflow coolers with splash fill or splash fill towers with a crossflow configuration. For splash fill, the packing volume, and not just the surface area, determine cooling capacity. 11 For crossflow towers, the volume matters as well, if the towers exceed a certain height and width to height ratio. 12 Patton concludes that the cooling towers of Khushab 1 likely have a crossflow configuration (see figure 4), but are of acceptable height to use the area approach, while Khushab 2 and 3 seem to also use counterflow coolers. The placement of the water pipes leading into the cooling towers support this conclusion (see figure 5).
Based on the piping configuration visible in commercially available satellite imagery, the cooling towers of the TPP and Khushab 4 also look more like counterflow coolers than crossflow coolers. We consulted an expert in cooling towers who shared that conclusion.
![]()
Figure 4. The cooling towers of Khushab 1 with visible piping.
![]()
Figure 5. The cooling towers of Khushab 2 and 3 with visible pipes.
The fill type is more difficult to determine based on imagery. Although an image of the TPP cooling tower under construction is available to us (see figure 2), the fill type could not be determined. However, based on the height of the cooling towers, we and the consulted expert, assess that the fill is more likely film fill than splash fill for all four reactors and the TPP coolers. Patton assessed the same for the Khushab 1 - 3 reactors.
If the cooling towers are counterflow with film fill, then their power is proportional to their cross sectional area. 13 However, if the fill is splash fill, then the packing volume matters and the cross sectional area measurement alone may not give you a reliable power estimate.
Nonetheless, in this estimate, we assume that all the cooling towers are similar with film fill. Comparing the area results in lower estimates of the power of the reactors than the volume method above.
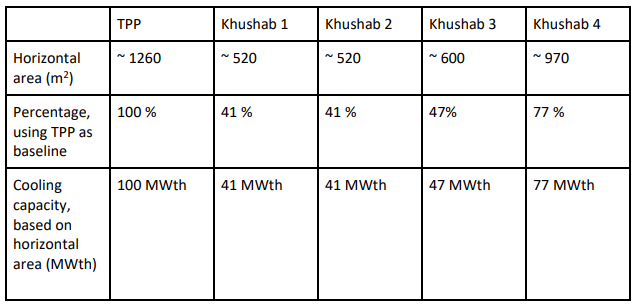
Table 2. Horizontal area of the cooling tower sets and inferred cooling capacity, from TPP data.
A third estimate, called Case 1 in table 3, involves using Berman’s film fill rate of heat discharge estimate of about 60,000-80,000 kcal/m2-hr (0.0697 - 0.093 MWth/m2)14 and multiplying it by the surface area of the cooling towers. Patton used Berman’s upper bound value of 80,000-100,000 kcal/m2-hr (0.093 - 0.1162 MWth/m2) which is the upper bound of mechanical draft coolers with unspecified design, and that range is also included to ease comparison (Case 2 in table 3). 15 The estimated cooling capacity of 100 MWth for the TPP falls within the range of the calculated capacity in case 1.
Khushab 2 and 3 are expected to have the same power, despite differences in efficiencies of their cooling towers. Khushab 3 has the greater cooling tower volume but Khushab 2 has a greater number of fan blades and they are longer (see table A2 in the annex).
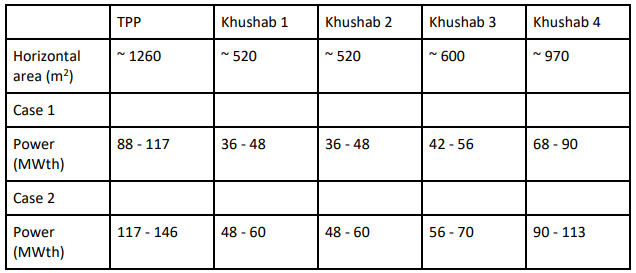
Table 3. Cooling capacity based on horizontal area using literature values of mechanical draft coolers.
Conclusion
The data show that compared to the Khushab 1 reactor, reactors 2 and 3 have a slightly increased, similar cooling capacity. In comparing the cooling towers visually, it becomes evident that the Pakistanis have varied the cooling tower design likely associated with efficiency, including the number of fan shafts, their diameter, and the number of blades. Most strikingly, however, are the data of Khushab 4. Consistently, it appears to have greater cooling capacity than the other three reactors. Cooling tower volume and horizontal areas are about twice the size of reactor 2 and 3. Reactor 4 cooling towers have a high number of fan shafts, the diameter of each being twice the size of Khushab 3’s fan shafts, and the greatest area of cooling tower subsets.
For the Khushab 1 reactor, based on both volume and horizontal area analyses, and that the cooling towers do not appear to be counterflow, film fill type, the power capacity is estimated at about 30-40 MWth, which is less than estimates by U.S. intelligence officials in the 1990s. While earlier estimates had put the capacity at up to 70 MWth, an estimate from 1995 stated that the reactor power was about 40 MWth.16
For reactors 2 and 3, the power appears to be about 40-50 MWth. For reactor 4, the power is estimated at about 80-90 MWth, or about double the power of Khushab reactors 2 and 3. We ignored the relatively high power estimates from scaling the volume of the cooling towers for reactors 2, 3, and 4, which appear to have film fill. This led us to also ignore case 2 in the table as well. This conclusion may need revisiting if the TPP cooling towers have a significantly greater power discharge value than 100 MWth.
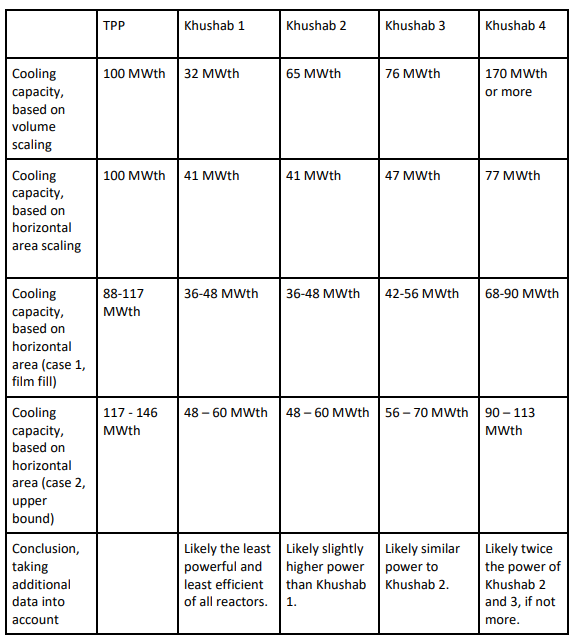
Table 4. Comparison of Reactor Power Estimates
Annex: Uncertainties and Additional Information about the Mechanical Draft Cooling Towers
Height measurements were taken from several satellite images indirectly and were dependent on clear shadows and accurate sun elevation angles provided by the image vendor (see Table A1). Observing clear shadow demarcations posed a challenge especially for Khushab 1 and 2, which have buildings and trees surrounding the towers. A decision was made to use the best image, e.g. the shadow is most visible, to estimate a height, rather than averaging heights over several images, where the shadow was blurry or more difficult to identify. In measuring the cooling tower volume, only the height of the frame was measured and not the part of the tower that exceeds beyond the frame serving as outlet of the steam above the fan.
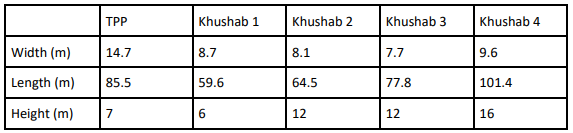
Table A1. Cooling Tower Dimensions
Additional measurements of the cooling tower were also collected from satellite imagery, namely the number and dimensions of the fan shafts of the cooling towers (see Table A2). The number of fan shafts is included, because a greater number of shafts generally speaks for greater efficiency. The same counts for the number of blades per fan shaft. The fan shaft diameters may also indicate efficiency. In general, the greater the diameter of the fan shaft, the more efficient the design. The area of cooling tower subsets may provide a relative comparison for HVAC requirements, or cooling back-up requirements, where a greater requirement would indicate greater power capacity.
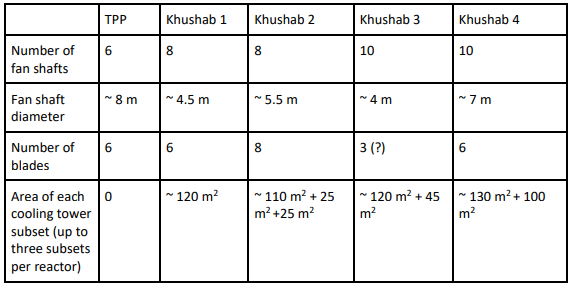
Table A2. Additional data that could affect the efficiency and power of the cooling towers. The last row includes the area of each cooling tower subset (see figure 1).
1. David Albright, Sarah Burkhard, Claire Chopin, and Frank Pabian, “Thermal Power Plant at the Khushab Plutonium Complex is Nearly Complete,” Institute for Science and International Security, May 23, 2018, http://isis-online.org/isis-reports/detail/thermal-power-plant-at-the-khushab-plutonium-complex-is-nearly-complete/12#images ↩
2. Thomas Cochran, “What is the Size of Khushab II?” Natural Resources Defense Council, Inc., September 8, 2006, https://www.nrdc.org/sites/default/files/nuc_06090801a.pdf ↩
3. Lev Davidovich Berman, Evaporative Cooling of Circulating Water (Oxford: Pergamon Press, 1961), p. 263 ↩
4. Simply put, a mechanical draft cooling tower uses a large fan to induce air flow, increase efficiency, which increases efficiency and dramatically decreases the size of the cooling tower needed. The alternative is a natural draft cooling tower, which is the signature hyperbolic, concrete cooling tower of a nuclear reactor and is up to about 200 meters high and made from concrete. For more information see Mulyandasari, “Cooling Tower Selection and Sizing (Engineering Design Guideline),” KLM Technology Group, July 2011. http://www.kolmetz.com/pdf/EDG/ENGINEERING%20DESIGN%20GUIDELINES%20-%20Cooling%20Towers%20-%20Rev01.pdf ↩
5. Tamara Patton, “Combining Satellite Imagery and 3D Drawing Tools for Nonproliferation Analysis: A Case Study of Pakistan’s Khushab Plutonium Production Reactors,” Monterey Institute of International Studies, October 16, 2012, http://npwg.berkeley.edu/wp-content/uploads/2014/10/Patton.pdf ↩
6. National Electric Power Regulatory Authority, Generation Licence No. SGC/120/2017, Islamabad, Pakistan, August 31, 2017, http://nepra.org.pk/Licences/Generation/CPPs/Pakistan%20Atomic%20Energy%20Commission/LAG-382%20GL%20PAEC.pdf ↩
7. Amin Yusufzai, “Pakistan Atomic Energy Commission Gets License for 50 MW Coal Power Plant,” ProPakistani, September 2017, https://propakistani.pk/2017/09/06/pakistan-atomic-energy-commission-gets-license-50-mw-coal-power-plant/ ↩
8. “Cooling Power Plants,” World Nuclear Association, updated February 2018, http://www.world-nuclear.org/information-library/current-and-future-generation/cooling-power-plants.aspx ↩
9. The height was measured indirectly, using shadow lengths and sun elevation angles in the following formula: height of the object = length of the shadow *tan(sun elevation angle). ↩
10. Albright and Serena Kelleher-Vergantini, “Khushab Reactors Operational While New Construction Progresses,” Institute for Science and International Security, February 29, 2016, http://isis-online.org/uploads/isis-reports/documents/Three_Khushab_Reactors_Operational_February_29_2016.pdf ↩
11. “Evaporative Cooling of Circulating Water,” pp. 280 and 286. ↩
12. “Combining Satellite Imagery and 3D Drawing Tools for Nonproliferation Analysis: A Case Study of Pakistan’s Khushab Plutonium Production Reactors.” ↩
13. The unit heat load can be expressed in terms of power over area. See, for example, “Evaporative Cooling of Circulating Water,” pp. 262, 284, and 285.↩
14. 1 kcal/hr = 1.16222222 × 10⁻⁶ megawatts↩
15. Patton used slightly different area values as she included the area of the cooling tower subsets, for example. Her final maximum capacity ranges are 43 - 54 MWth for Khushab 1, 58 - 73 MWth for Khushab 2, and 72 - 90 MWth for Khushab 3. ↩
16. Albright, Frans Berkhout, and William Walker, Plutonium and Highly Enriched Uranium 1996 - World Inventories, Capabilities and Policies 1996 (Oxford: Oxford University Press and SIPRI, 1997), p. 279.↩
 email us
 twitter